Mixing apples and oranges: lessons from building actor-based system maps
Making sense of youth unemployment in Tunisia


The life of the average systems analysis is quite short. It’s read once, it might get cited a few times for its headline insights, and then it’s quietly forgotten. When the Challenge Fund for Youth Employment (CFYE) asked us to make sense of youth unemployment in Tunisia, they were explicit about wanting something different. They wanted something that their team would actually use when deciding where to invest.
Youth unemployment in Tunisia sits at around 40%: two out of five young Tunisians who want work cannot find it. Economists treat this as a labour-market problem, political analysts treat it as a stability problem, and young people themselves describe something closer to a problem of dignity. This is exactly the kind of wicked problem that pulls people to “take a systems approach” or to “embrace complexity.”
Most practitioners I talk to find those ideas easier to endorse than to apply, partially because the methods associated with systems approaches can be quite abstract and hard to operationalise. The iceberg model, for example, invites you to look beneath events for patterns, then structures, then mental models. This sequence is really intuitive, but each layer is more abstract than the last, and the diagram you end up with rarely tells you what to do on Monday morning. Similarly, when using an approach like causal loop diagrams, you’d be mapping “variables”, but that can leave you feeling uncertain about what to include and at what level of abstraction.
By contrast, actor-based systems mapping offers a more pragmatic path. It centres on the people and organisations whose behaviours, relationships, and interactions actually shape system outcomes. If you want to change a system, you have to understand who’s in it, how they behave, and what connects them.
A few years ago, while working at Integrity, I had the opportunity to put this approach into practice. In partnership with The Canopy Lab, we conducted a systems analysis for the Challenge Fund for Youth Employment (CFYE) in Tunisia, implemented by Palladium for the Netherlands Ministry of Foreign Affairs. The goal was to unpack the wicked problem of youth unemployment, and to do so in a way that would help the Challenge Fund identify where their investments could have the greatest impact.
This post shares what we learned about building actor-based systems maps, with a particular focus on a challenge that proved central to our work: how to integrate fundamentally different types of information into a single coherent picture.
Actors, behaviours and relationships
Youth unemployment in Tunisia isn’t a simple problem with a single cause. It emerges from the interactions of countless actors (employers, training providers, government agencies, young people themselves, families, investors, unions, and many more) all adapting to one another and their environment.
This perspective comes from complexity science. As the Santa Fe Institute puts it, complexity arises in any system where many agents interact and adapt. The outcomes we observe at the macro level, like high youth unemployment, are emergent properties of these interactions.
The practical implication is significant: if you want to address a problem like youth unemployment, you first need to identify the actors in the system and understand how they behave with respect to one another. This reframes the challenge from something abstract and overwhelming to something more tangible and addressable.
To structure our analysis of youth employment, we drew on the Actor-Based Change (ABC) Framework, which I co-developed with colleagues while at Palladium. By mapping actors, their relationships, and the behavioural conditions that shape their actions, we created a foundation for identifying where and how change might happen.
Gathering data: a mixed-method approach
For the Tunisia analysis, we knew that no single research methodology would give us a complete picture. As I mentioned above, youth unemployment sits at the intersection of market dynamics, political economy, and individual lived experience (among others). To capture this complexity, we designed a research approach with three complementary streams.
Market Systems Analysis examined the supply and demand dynamics of the labour market. This involved mapping value chains, including how goods, services, and money flow between actors, as well as identifying where these flows break down or underperform. We looked at the ICT and agricultural processing sectors to understand what was constraining job creation and youth employment.
Political Economy Analysis focused on power; how it’s generated, maintained, and used to shape the system. This meant examining formal and informal institutions, the incentives different actors face, and the structural features (history, geography, demographics) that constrain what’s possible.
Community-Led Research brought in the perspectives of young people themselves. Working with youth associations, we trained young researchers to conduct interviews within their own communities. This surfaced insights about perceptions, aspirations, and barriers that wouldn’t have emerged from expert-led research alone.
Each stream produced rich findings. But they also produced fundamentally different types of information, which raised a question we hadn’t fully anticipated.
Apples and oranges
Here’s the challenge we faced: market analysis mostly gives you visible, measurable flows. You can see goods being transported, track financial transactions, or count how many people move between training providers and employers. These relationships are quite concrete.
Political economy analysis surfaces something quite different: power dynamics, informal rules, patronage networks, institutional inertia. These relationships are real and consequential, but they’re not visible in the same way. You can’t measure influence the way you can measure unemployment.
Community research adds yet another layer: perceptions, trust, social norms, aspirations. A young person’s belief that “the system is rigged” shapes their behaviour just as much as whether training programmes actually exist.
These different kinds of information all drive actor behaviour at the same time, which forces them into the same map. For example, a young graduate’s decision about whether to apply for a job is shaped by market conditions, by their perception of how power works, and by what their family and community expect. Separating these into different maps would lose precisely the interconnections we were trying to understand.
So, we ended up mixing apples and oranges into a fruit salad.
The result was a Kumu map that could hold multiple types of truth simultaneously. It represents both the formal and informal, the visible and hidden, the measurable and perceived. Because it combined these different perspectives, it revealed patterns and connections that wouldn’t have been visible in any single-lens analysis.
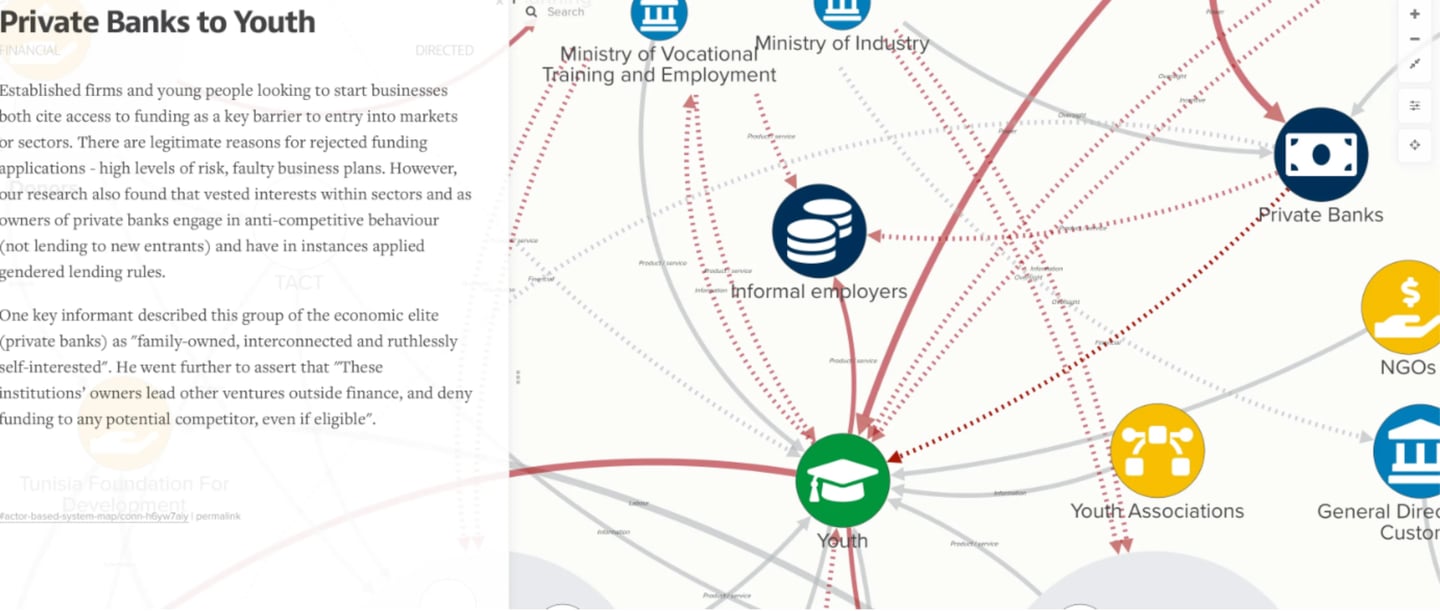
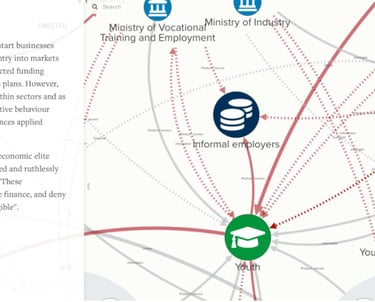
Relationships are annotated by type, in this case it’s a financial flow from private banks to youth, which is classified as a problematic one.
From Map to Insight
Now that the map included all these different types of flows, we faced a new challenge: the map contained dozens of actors and hundreds of relationships. Looking at it in its entirety, a tangle of nodes and lines, seemed to confirm complexity without clarifying it.
This is where the power of Kumu really shines. Kumu’s filtering, focus and presentation features let us tell specific stories: how information flows between training providers and employers, how power relationships at the national level constrain what is possible at the local level, where young people perceive bottlenecks that do not appear in official accounts.
Two examples give a flavour of what an integrated map shows that a single-lens analysis would not.
Job matching service providers sit between large numbers of jobseekers and large numbers of employers. There are not many of them. That position is not visible if you look only at the supply side, or only at the demand side. The presentation mode on the Kumu map made it obvious. A small set of intermediaries had outsized leverage over how the labour market actually clears, which made them an unusually high-impact partner for CFYE relative to the size of the investment.
A different kind of insight emerged at the bottom of the system. The market analysis showed a coordination problem: employers, training providers, and job-matching services were operating with poor information about each other. The political economy analysis complemented this by showing why national-level reform was unlikely to fix it, given the vested interests in current arrangements. Finally, community research showed that young people, the actors most affected, also had the most latent energy to act. Together, this pointed to a clear leverage point: strengthen network governance at the local level, with youth in the role of activators connecting actors who were otherwise talking past each other.
We ended up drafting five entry points along these lines, all of them grounded in the map. The map’s job was to make those choices defensible and showed what each was meant to change in the system.
Lessons Learned
Several insights emerged from this process that might help others attempting similar work:
Start rough. We began with whiteboards and sticky notes (Kumu has an excellent integrated option: Sticky Studio). Export this to Kumu later, once the map’s basic structure had stabilised.
Invest in data structure. Every actor and relationship in our map was backed by a structured database that linked to detailed source findings. This made Kumu imports straightforward and allowed us to trace any element back to its evidence base.
Aim for enough. The actual system is always more complex than any map can represent. The map was useful because it captured enough to support strategic decisions. Trying to capture everything would have made it useless.
Conclusion: Maps as invitations to dialogue
One of the most important lessons we learned was that we shouldn’t aim for the map to be exactly “right”, but that it was much more about making implicit assumptions explicit and debatable.
When you represent a system as a network of actors and relationships, you create something people can point to and question. “Why did you draw that connection?” “What about this actor, shouldn’t they be included?” “That relationship is much weaker than you’ve shown.” Each of those challenges sharpens the analysis.
Actor-based systems mapping offers a pragmatic way to engage with complexity. It moves us from the abstract recognition that “things are complicated” to a concrete account of the actors involved, and where change might begin between them.
Explore the Tunisia map yourself: The interactive map is hosted on Kumu, allowing you to click on actors and relationships, filter actors relevant by theme, and explore the different layers of the system at your own pace. It includes a guided presentation to unpack some of the complexity of the system.
Read the full methodology: We developed a Strategic Framework for the Challenge Fund to document this approach in detail, including practical guidance on conducting the research and synthesising findings.
Continue the conversation: I’ve since founded Ripple CoLab, where I continue to apply and develop actor-based approaches to complex challenges. If you’re grappling with similar questions, or if you’ve found different ways to mix your apples and oranges, I’d love to hear from you!
Mark Oldenbeuving is the Founder of Ripple CoLab and co-creator of the Actor-Based Change Framework. The Tunisia systems analysis was conducted while he worked at Integrity, in partnership with The Canopy Lab, for the Challenge Fund for Youth Employment.
This is a cross-post of a blog first published on Kumu's In Too Deep blog.